Every day there are announcements of new biomarker discoveries. Yet, very few biomarkers are validated, and even fewer are ever used clinically. Having a relevant process, and understanding some of the issues upfront to avoid pit falls should improve this.
What lessons are there to help improve this situation?
The next figure illustrates a high-level approach. At the end of the essay is quantitative information from a simulation using real-world data.
More specifically, the following example shows some practical, specific milestones.
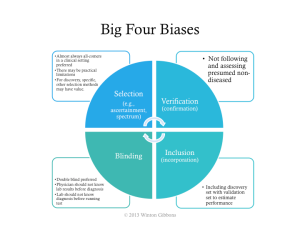
As noted in the overall process, trial design issues should be avoided. The major biases should be assessed: selection, verification, inclusion, and poor blinding.
If the big 4 biases are not controlled, then a higher estimated performance than appropriate will likely be calculated, such as those shown in the next figure.
If one cannot get sufficient numbers of patients there are ways to mitigate potential false discoveries. The most used approaches are
Bonferroni correction (most conservative)
- Divide the desired p value (probability of true discovery) by the number of biomarkers or algorithms tested.
- This establishes the new p value that any biomarker or algorithm must pass.
False discovery rate
- Similar to Bonferroni for assessment of the biomarker | algorithm with the best p value.
- For subsequent, the desired p value is divided by the number of biomarkers | algorithms remaining to be assessed (i.e., the correction gets easier if some biomarkers | algorithms pass)
Simulation
To give some specificity to potential ways to improve, a simulation was conducted – using actual biomarker data – in order to help frame quantitatively sample sizes, numbers of markers, and often less considered, disease prevalence.
The key lessons on proportions were
- Don’t use less than 250 patients, even when assessing only a few markers
- Start to beware retrospective individual marker discovery at 50 potential markers, in the context above
- For multi-marker indices, beware starting at 25 potential markers
- When prevalence is below 12%, then use more than 1,000 patients
- Using 500 to 1,000 patients with a prevalence greater than 12%, is relatively good, even up to assessing 100 markers
In the simulations run the number of patients varied from 50 to 1,000 patients, the number of markers varied from 1 to 100, and the prevalence varied from 6% to 50%.
The further noteworthy findings included
- Degrees of freedom can dramatically affect retrospective biomarker analysis.
- As either the prevalence, or number of patients decrease, the higher the risk for perceived but random positive results in marker mining.
- False AUCs (area under the curves or c-statistics) can be quite high.
- The average experimental AUC for random single markers was 0.62, with the highest a whopping 0.97.
- The average experimental AUC for random multi-marker indices was 0.65, with the highest a perfect 1.00.
Biomarkers have great value, but only when valid. Having an approach, understanding the patient numbers required, and avoiding biases should increase the chance of success.
Below is a presentation of the material presented above.
Detailed Perspectives on Biomarkers Discovery and Validation – Presentation
Here is an infographic.
Detailed Perspectives on Biomarker Discovery and Validation – Infographic


[…] the curve (AUC), was highlighted. That topic is very rarely if ever discussed. In another essay on biomarker discovery, disease prevalence as a driver of analysis was examined. Combining prevalence with ROC analysis […]
LikeLike
[…] Biomarker Discovery and Development – Detailed Perspectives […]
LikeLike
[…] Every day there are announcements of new biomarker discoveries. Yet, very few biomarkers are validated, and even fewer are ever used clinically. Having a relevant process, and understanding some of… […]
LikeLike